Sunday, July 22, 2018

Answer: How do you plot out data by region? The case of regional boundaries.


Our goal is to plot data by region.. 

.. an immensely handy thing to be able to do if you want to do basic analysis of geo-localized data.  For instance, here's a map of all the counties in the US, with color mapping out the median income for each county: 

Figure 1. Median household income by county (2012). P/C Wikimedia.


Our Challenge for this week was to do something very similar--let me remind you of our Challenge:  

1.  Can you make a map of the median household income for each of the MSAs in the United States?  (Or equivalent statistical areas, if you're from another country.)  

As I pointed out, we can break down this problem into a few pieces: 
1. Find a data set for the median household income that's organized by MSAs.   
2. FInd a data set for the MSAs shapes.  
3. Find a visualization application that can ingest both the median income data and the shape of the MSA and create a map similar to that above.  
Here's what I did for each of the three steps.  

1.  Find the data set.


My query to find the MSA income data:

     [ median income united states data 2017 intext:msa ]  

This query led me fairly quickly to the FFIEC  data tables (Federal Financial Instutions Examination Council).  
Remember that the intext:  operator requires that the term "MSA" be part of the document.  That's exactly what I needed to do in order to find this.   
Figure 2. The data for median family income by MSA.

In particular, it wasn't hard to find that https://www.ffiec.gov/Medianincome.htm  had an Excel spreadsheet with median incomes where each row has the income and the code for one of the MSA regions.  

This gives us the following spreadsheet (I downloaded the EXCEL file in row 1 above): 

Figure 3.  The data table opened up to show the first 11 values of median income. Note the NSA/MD FIPS CODE NO.  (That's the code for the particular MSA region.)  

 I opened this XLS, then deleted row 1 (to get rid of the not-very-useful heading information) and then deleted column C (to get rid of the data from 2015 that I don't want to show).  

Then, I opened that Excel file in Fusion Tables because I happen to know that Fusion Tables has a way to import both Excel data files (like the one above) AND shape-files (like those that define the MSAs).  

That Fusion Table now looks like this with just the GEOID (that is, the MSA number), the MSA area name, and the FFEIC estimated median family income (which is what we wanted to plot): 

Figure 4.  The data from the XLS spreadsheet imported into a Fusion Table. 


Now I need to find the MSA boundaries.  How can I do that?  Easy.  I did a search for KML files (which I know Fusion Tables can read) with this query:  

     [ census metropolitan cartographic boundary KML files ] 


On that page, I found the  Core Based Statistical Areas (CBSAs in KML format):  cb_2017_us_cbsa_500k.zip  This is a ZIP file (compressed), so you have to download it and decompress it, which gives you a bunch of   .KML  and .XML files.  Here, I'm just interested in the KML files.  They're the MSA "shapefiles," each of which outlines each of the MSAs.  

Now I want to somehow grab all of these MSA shapes and line them up with each MSA median household data.  To do this, I'm going to import these shapes into a second Fusion Table, then merge the two tables together.  I'll make sure that both tables have rows that can line up and can be merged together because they have the same name and same values. 

Here's how I did it:  

We've already got one Fusion Table with all of the median incomes and a GEOID code telling us what MSA area that data represents.  Now, make a second Fusion Table to hold all of the KML regions, each of which has a code that's the same as the GEOID code.  

Figure 5. The KML (shapefiles) for each of the MSAs in the US.  

You can import the KML into it by just opening the KML file.  This should have a nice map with all 462 MSA regions on a map of the US. 

Once you open the cb_2017_us_cbsa_500K.kml file in Fusion Tables, you should see this: 

Figure 6: Fusion Table after I loaded the KML file with all of the MSA shapes. 
This shows all of the MSA shapes in the KML file.  Notice anything odd? 
   
If you click on the Rows1 tab, you'll see each row that defines one of those MSA shapes.  (The actual KML is in the far right-hand column.)  

Figure 7.  The MSA Fusion Table with the GEOID in the 4th column,
 and the geometry of each MSA in the rightmost column


 Now, let's step back for a second. 

We have 2 Fusion Tables.  One with the median income and an MSA region (both with the name and the GEOID for that region).  The other table has the KML shapes and a GEOID.  

Now I want to MERGE the MSAs map shapes into the MSA income data where the rows have the same GEOID (that is, the same MSA region).  

Notice that the column labeled GEOID has a unique identifier for each MSA region.  Notice that the Median income data table also has a column labeled “MSA/MD FIPS CODE NO.” – that’s the same thing. 

Now, START with the Income Fusion Table.  Then select File>Find a Table to merge into this one.  The idea is that we'll pull in the MSA shapes (from the MSAs (2017) Fusion Table) and line up the matching rows with the same GEOIDs.    

Figure 8.  How to merge the household income Fusion Table with another table.
(That is, to "fuse" them together.)  


Select a table (with matching columns):

Figure 9.  Select the corresponding spreadsheet (in this case, the first one with the income data). 


When you do this, it will align the rows with the same data in the GEOIDs field, and give you something like this.  

Figure 10.  The default MSA median income data shown as a color of green.  (This is the default coloring pattern.)

There are a couple of problems with this map. 

(1) The colors are all kind of the same.  The default color scheme is a gradient of greens, but that doesn't quite distinguish the different values very well.  We can fix this by changing the colors assigned to each income range.  To do this, you have to edit the colors assigned to each income range.  To do this, you have to change the settings for the "map feature style"


Figure 11.  How to change the polygon fill pattern to show
different income ranges as differing colors. 


What you'll want to do is to change the range / color assignment.  To do this, just click on the "Buckets" tab.  That menu looks like this: 


Figure 11.  Changing the buckets and the corresponding colors. 

This menu option lets you change the bucket sizes (and notice that you have to scroll to get to all of the buckets).  For each bucket, you can pick your own colors.  Here's another version of the median income map.  You can easily change the colors to emphasize (or de-emphasize) whatever data features you'd like.  

Figure 12.  The new MSA map with a somewhat better color choice.  


However... 

(2) The biggest surprise to me was how many MSAs seem to be missing, including some close to where I live.  (See the map below...)  In particular, how is it possible that the greater San Francisco area is missing?   


Figure 13.  A closeup of the map.  Some MSA regions seem to be missing!  

What happened to San Francisco??  

There's some kind of missing data.  This was so striking, I had to check.  

First, look up above at the map that shows all of the MSAs ("MSAs (2017)" with all of the red blobs).  There are a LOT of open spaces in the map.  Surprise!  The MSAs do not cover the entire United States.  I didn't realize this when we started this Challenge, but the MSAs are an incomplete cover of the US landscape.  That's observation 1.


Second, it looks like some MSAs are just plain missing in the original spreadsheets.  (See Figures 3 and 4.  We can see that the MSA region is in the dataset for San Francisco, but when we look in the median income database, we see it's in there.  

I puzzled over this for a long time (like... 4 hours!) before I figured out what happened.  The GEOID code for the San Francisco MSA was wrong in the map file.  I noticed this because I finally pulled out the records for both the MSA spreadsheet and the one line of the MSAs Regions KML file.  In the "median income" file, the GEOID was 41884, while in the "KML regions" file, the code was 42034!  

Basically, a Fusion Table takes two (or more) data tables that have a column in common.  In this case, I used the GEOID code to line up the data sets.  As you saw, it worked pretty well.

But if a code is wrong (as it was in the MSA KML mapping file), then only half of the data transfers--in this case, the KML region doesn't get copied over.  Damn.  THAT took a while!  

To fix it, I just opened the "incomes" spreadsheet, and fixed the GEOID number so it would line up with the KML regions file.  And, voila!  The closeup of the San Francisco region now looks like this (notice that I changed the colors once again... I was experimenting with different settings):  


And yes, the Median Family Income for the Bay Area in 2017 was $113,100 / year.  

Naturally, after I did all this, as I was cleaning up my tabs I found a really great example (with videos!) on how to do this.  If you're interested in this kind of data understanding, check out Ken Blake's instructional web page and videos.   (It's really done quite well.)  


SearchResearch Lessons 

Well, we didn't get a lot of comments this past week.  I don't know if it's the summer slump, or if people just didn't find this kind of demographic analysis interesting!  (Let me know in the comments.  If nobody speaks up, I won't do many of these in the future.)  

There were a couple of things to take away from this lesson: 

1.  You have to know what your tools can do.  In this case, I had a headstart because I knew that Fusion Tables could do something close to this (especially the mapping part).  Of course, one of the SRS skills is toolfinding.  (When you find yourself trying to do something complicated, check for a tool that can help you out.)  

2. Remember how to use intext: to require that a particular key search term is on the page.  When you really need that term to be there, intext: can really, really help. 

3.  Not all data sets are error free!  Yes, I know this data set came from the government... but they have typos too.  And remember that as data sets grow larger, it gets increasingly difficult to spot typo-type errors.  An excellent practice is to spot check a number of different locations (and to check with a filter, if you can).  I ended up finding several more coding errors in that data set. 


Postscript:  Sorry that this week's SRS post was a little delayed.  I was traveling to a wonderful event--the Salzburg Global Seminar--and was busy giving talks, and talking with a bunch of very smart and completely fascinating people.  I'm actually flying on Wednesday, but will try to post the Challenge before we lift off.  (But if I don't get it out, you'll know what happened.)  


Wednesday, July 11, 2018

SearchResearch Challenge (6/11/18): How do you plot out data by region? The case of regional boundaries.


It's time for a Challenging Challenge!  

As you know, every so often I like to mix up the SRS Challenge with something that's a bit more in-depth.  (And if this is overwhelming, just take the week off--I'll be back next week with an easier one.) 

The Setup:  If you read the news these days you'll see all kinds of claims about various kinds of data.  In an earlier SRS post we talked about immigration rates, and found that the data is a bit complicated, but you can figure it out.  

One of the things you'll see in the news are charts like this one: 

.. by COUNTY (not MSA or CSA).

This is the "Median household income in 2012 by county."  This chart is from Wikimedia and shows the median income by county in the US.  Of course, counties are sometimes just arbitrary boundaries.  They may or may-not make sense.  (For instance, Los Angeles County has around 10M souls living inside the county, while only 600K people live in Providence county, Rhode Island.  That's a factor of 16X difference in size.) 

There are many ways to draw regional boundaries that make some kind of sense. For instance, gerrymandering is the practice of drawing political boundaries to give a particular party more (or less) voting power.  

There are commercial regional boundaries (such as the "Designated Market Areas," aka DMAs, define by the polling / survey company Nielsen).  These regions correspond to media markets.  
More often, though, people who are looking at data use either "Metropolitan Statistical Areas" (MSA).  An MSA is “is a geographical region with a relatively high population density at its core and close economic ties throughout the area.”
For instance, the San Francisco-Oakland-Hayward Metropolitan Statistical Area (with a population of 4.5 million) and the larger San Jose-San Francisco-Oakland Combined Statistical Area (8.4 million) are both near where I live in Silicon Valley.  
A slightly different version of the MSA is the "Combined Statistical Area" (CSA), whi is composed of "adjacent metropolitan (MSA) and micropolitan (μSA) regions in the United States and Puerto Rico that can demonstrate economic or social linkage."  (This is primarily defined by commuting patterns.)  
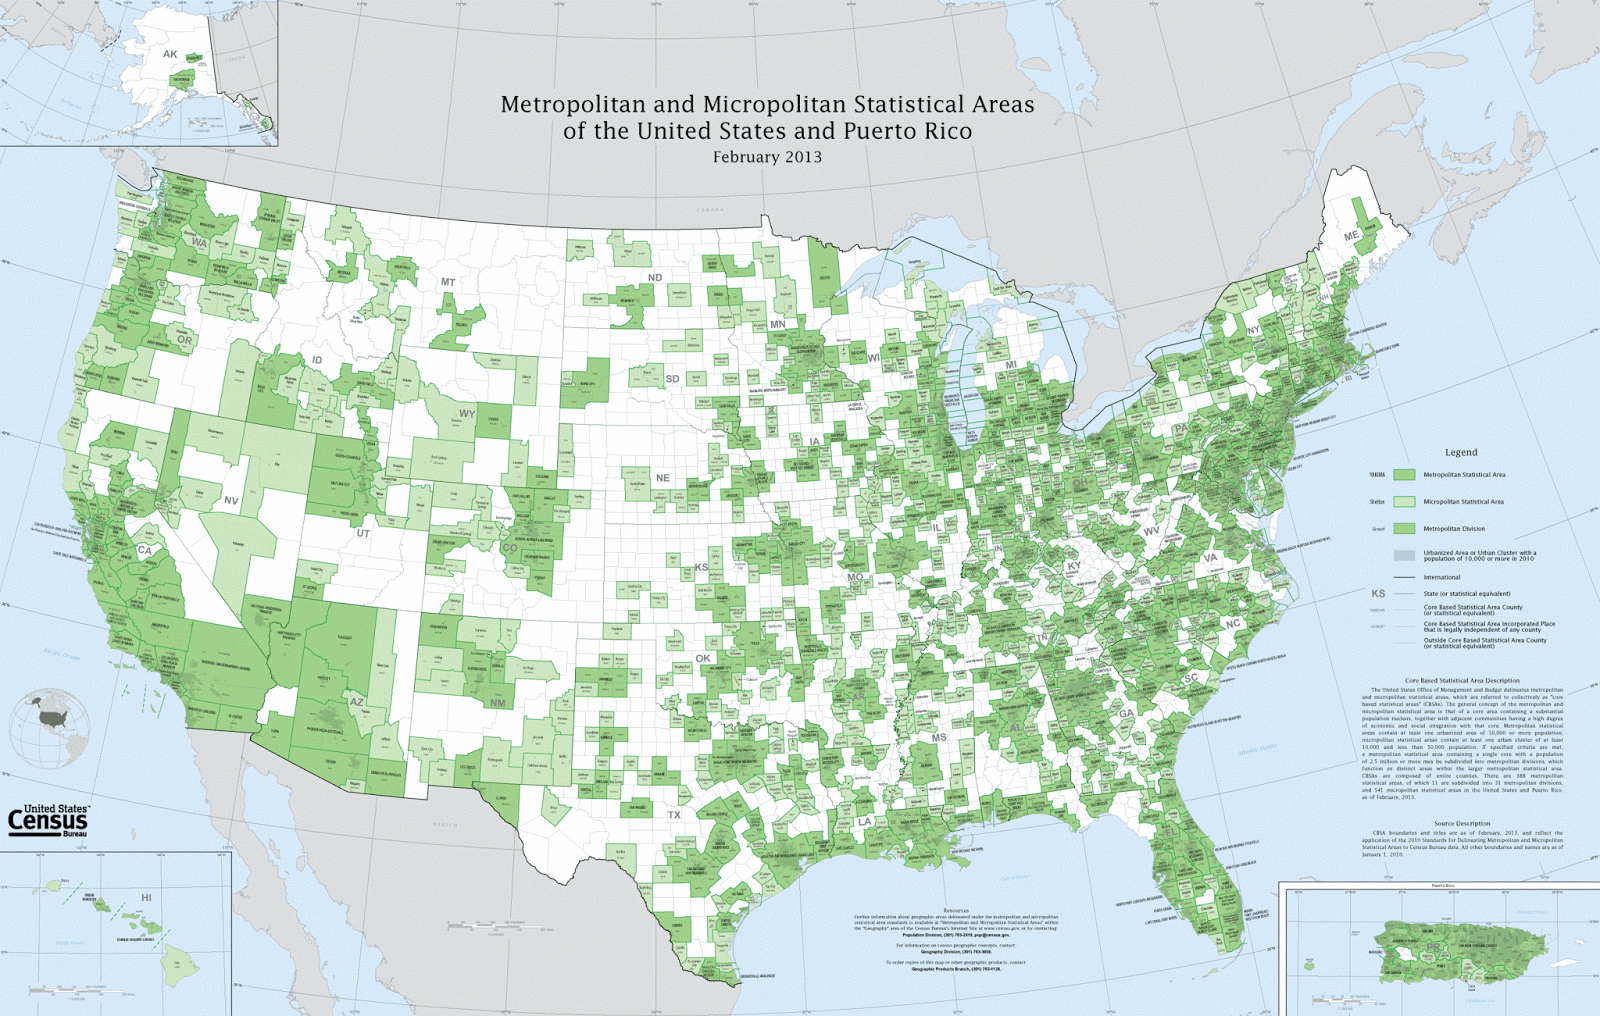
A map of the combined metropolitan and micropolitan statistical areas of the US looks like this: 
Wikimedia

I'm telling you all of this background because it leads to today's Challenge.  
1.  Can you make a map of the median household income for each of the MSAs in the United States?  (Or equivalent statistical areas, if you're from another country.)  
That is, you'll need to: 
A. Find a source of recent data that's organized by MSAs.  2017 would be best, but you should look for the most recent data. 
B. Find a visualization application that can ingest both the median income data and the shape of the MSA.   
C. Figure out a way to create a visualization of the US MSAs that color-codes the income.  It should look a bit like the above example, except with the income level determining the color of the MSA region.   
This is a bit of a Challenge, but it doesn't require programming.  (If you want to program, be my guest, but this doesn't really need it.)  
And, if you really don't like MSAs as the boundaries of map regions... find a different one, and tell us why you like yours better.  
Once you figure out how to do this, you'll have the means to do your own analysis, looking at data in your own way.  
Search on!  


P.S. This is the kind of thing that Data Scientists do all the time.  With this Challenge, I'm hoping to instill some of the skills and values that Data Scientists bring to the job every day.  Hope you have fun with it.  I'm looking forward to your comments! 


Wednesday, July 4, 2018

Answer: How big was the range of these animals?


What's the original / natural range?   

The basic question from last week's Challenge was "What was the original or natural range of these three animals?"  (Lion, Ground Sloth, Camel)  It's a natural enough question, but the answers can be surprising.  


The Challenge was:  


If there were, once upon a time, lions and camels and ground sloths  (Oh my!) in North America, what was their historic region?  During the past 100,000 years, where could you find camels, lions, and ground sloths?  

Basically what we're looking for is a map of  the ranges of these animals.  But... it's tricky.  The obvious queries like: 
     [ historic range lion ] 
can give us conflicting answers.  What's going on here?  

With questions like this, we need to be very clear about what our terms actually mean.  It sounds obvious, but what, really, is a lion?  

For instance, it's easy to find this map from the above query on Wikipedia: 

"Historic lion range" per Wikipedia

But the number of variant answers that we see tell us that the problem is a little subtle:  

What do you mean by "lion" and what do you mean by "historic"?  

Reading the Wikipedia article about lions we find:  "In the Pleistocene, the lion ranged throughout Eurasia, Africa and North America from the Yukon to Peru.."  Really?  There were lions in North America?  

We must go deeper.  

And it doesn't take us long to learn that there are extinct subspecies of lions, and that today the American lion that lived during the Pleistocene is usually treated as a sub species of the African lion‭ (‬Panthera leo‭), ‬which is why it is more commonly listed as Panthera leo atrox.‭ ‬However there are a number of researchers who consider the American lion to be different enough from the African lion to give it its own distinct species of Panthera atrox.  ‬

But this is just the tip of the iceberg when dealing with the classification of the American lion and it‭’‬s easy to become lost in all of the multitude of theories and arguments about its true position in the Panthera clan.  

Of course, there's another lion that's known from its bones, the Eurasian cave lion‭ (‬Panthera leo spelaea‭), ‬which is itself another kind of closely related lion that went extinct about 13,000 years ago.  ‬This similarity has been confirmed by mitochondrial DNA analysis which shows that the American lion and Eurasian cave lion were almost identical,‭ ‬although the American does seem to have grown slightly larger.‭‭  (See the Wikipedia article about leo spelaea.)  

So if we look for range maps for each of these subspecies of lion (notice how I'm looking for this particular species name, not just for lion):  

     [ map range Panthera leo spelaea ] 

we'll see a number of maps, such as this one: 


Historic range (13,000 years ago) of Panthera leo spelaea  (From a paper on its genetics)

Although even this map seems a little incomplete--as we see in the Encyclopedia of Life entry about the American Lion, its range went down into northwestern South America.   (Another article about lions in South America.)  It never lived in Australia or Antartica, but something very much like a lion seems to have lived just about everywhere else.   

So... what's its original range?  Well, there were lions just about everywhere--in North and South America, as well as all of Africa, most of Europe, and vast swaths of Asia.  


What about the ground sloth?  We don't see them roaming around anywhere these days.  So what was their original range? 

Let's go back to our previous question:  What do you mean by ground sloth?  


The Wikipedia article on ground sloths seems fairly complete.  It tells us that (summarizing here):  

Ground sloths are a diverse group of extinct sloths in the mammalian superorder Xenarthra.... a term used as a reference for all extinct sloths because of the large size of the earliest forms discovered, as opposed to existing tree sloths... 
Much ground sloth evolution took place during the late Paleogene and Neogene of South America while the continent was isolated. At their earliest appearance in the fossil record, the ground sloths were already distinct at the family level. The presence of intervening islands between the American continents in the Miocene allowed a dispersal of forms into North America. A number of mid- to small-sized forms are believed to have previously dispersed to the Antilles. They were hardy as evidenced by their diverse numbers and dispersals into remote areas given the finding of their remains in Patagonia (Cueva del Milodón) and parts of Alaska. 
Sloths, and xenarthrans as a whole, represent one of the more successful South American groups during the Great American Interchange. During the interchange, many more taxa moved from North America into South America than in the other direction. At least five genera of ground sloths have been identified in North American fossils; these are examples of successful immigration to the north.

(And, yes, I checked other resources about camels, e.g., books about camel evolution.  This story checks out.)  

Reading through this, we see that ground sloths (the Xenarthrans) inhabited at least North and South America, from Patagonia to Alaska... AND much of the Caribbean!  That's a huge range.  Some varieties were just gigantic--five tons in weight, 6 meters (18 feet) in length, and able to reach as high as 17 feet (5.2 m).  These were significant megafauna of the American landscape.  

One particular kind of ground sloth has a special place in American history (which we're celebrating today, July 4th).  The megaloynx ground sloth was first identified by Thomas Jefferson in a paper that he presented before the American Philosophical Society on March 10, 1797: "A Memoir on the Discovery of Certain Bones of a Quadruped of the Clawed Kind in the Western Parts of Virginia."  


This paper is widely seen as establishing the science of vertebrate paleontology in the US.  Interestingly, Jefferson identified the Megalonyx as a giant lion, and asked Lewis & Clark to be on the lookout for any Megalonyx as they explored the American west in their expedition of 1804 - 1806.  Jefferson, along with many other scientists of the time, had no idea that animals could go extinct, and so he naturally saw these bones in terms of existing animal forms.  Alas, he missed the last Megalonyx by a few million years.  

But their range was clear:  It varied by species, but collectively, the ground sloths were found in the Americas.  


Finally, what about camels?  

Again I have to ask:  What do you mean by camels?  

If  we check the Wikipedia page on camels, we learn that dromedaries live in the Middle East and the Horn of Africa, while Bactrian camels are native to Central Asia, but live throughout remote areas of northwest China and Mongolia.  (Historically, the area known as Bactria is the flat region straddling modern-day Afghanistan, Tajikistan, and Uzbekistan. More generally, Bactria was the area north of the Hindu Kush, west of the Pamirs and south of the Tian Shan with the Amu Darya flowing west through the center.)  

But we also learn that an extinct species of camel in the separate genus Camelops, known as C. hesternus, lived in western North America before humans entered the continent at the end of the Pleistocene.

This takes us, once again, into a definitional moment.  

Looking up the evolution of camels, we learn that the earliest known camel, called Protylopus, lived in North America 40 to 50 million years ago.  It was about the size of a rabbit and lived in the open woodlands of what is now South Dakota. 35 million years later, the Poebrotherium was the size of a goat and had many more traits similar to camels and llamas. 

But the direct ancestor of all modern camels, Procamelus, lived in North America around 3–5 million years ago.  This proto-camel species, Camelidae, spread to South America as part of the Great American Interchange,  where they gave rise to guanacos and related animals.  They also spread to Asia via the Bering land bridge, including Ellesmere Island (in modern Canada, well above the Arctic Circle, near Greenland). 

Procamelus from the mid-Miocene in Colorado, by Robert Horsfall.
 (p/c: Wikimedia, from the book
  A history of land mammals in the western hemisphere by William Berryman Scott)  


The Wikipedia article on camels tells us that the "last camel native to North America was Camelops hesternus, which vanished along with horses, short-faced bears, mammoths and mastodons, ground sloths, sabertooth cats, and many other megafauna, coinciding with the migration of humans from Asia."

Well, that's interesting:  the American Lion, ground sloths, and camels all went extinct around the time humans appeared in the Americas.  

So if we consider as camels only "large animals with humps"  (and not the smaller camelids like llamas and guanacos), their range was historically North America, then spreading into central Asia and the Middle East.  

If you search for other possibilities (e.g., [ Europe camel] or [Africa camel]) all you'll find are references to the (relatively recent)  introduction of camels into those places.  

Likewise, camels seem to have spread a bit more recently into places you might not have expected.   

Around 700,000 dromedary camels are now feral in Australia, descended from those introduced as a method of transport in the 19th and early 20th centuries.  This population is growing about 8% per year, even becoming a problem as they consume resources in a limited landscape.  


In North America, after being away for a 15,000 years, a small population of introduced camels were imported in the 19th century as part of the U.S. Camel Corps experiment. Never a full part of the Army, it was a short-lived experiment to use camels in arid climes instead of horses. When the project ended a few years later, they were sold to be used as draft animals in mines, some escaped, or were released in to the desert. Twenty-five U.S. camels were bought and imported to Canada during the Cariboo Gold Rush.  (NYTimes article about the Camel Corps.)  

Upon finding water during a surveying trip, horses would drink immediately, while the accompanying camels would show little interest (see the camels in the upper right background). The Army’s camels proved they could withstand the oppressive climate of the American Southwest and other hardships that could send horses and mules into a panic. (Horses Quenching Their Thirst, Camels Disdaining, by Ernest Etienne de Franchville Narjot, courtesy of The Stephen Decatur House Museum)


Search Lessons 


There are two big lessons here (and one little one).  

1.  Be clear about what you're searching for!  In the case of the lion, do you mean to include American Lions?  Or only the African variety?  In our case, we chose to go with clearly related (albeit extinct) lions (e.g., the Cave lion and the American lion).  This changes your search strategy to include very specific terms, like Panthera leo spelaea, or Pathera atrox.  Likewise, we had to make a cutoff for camels since the evolutionary slope is a bit slippery.  We didn't want to include camelids like llamas, so we went with "big cloven footed animalas with humps" which evolved at a particular time.  (Note:  camels and llamas can interbreed, although like mules, the offspring is sterile... so we chose a morphological cut-point, rather than a clear species boundary.)  

2.  Checking Images is sometimes helpful for finding maps that give extents.  As a general strategy, I often check Google images for information that's presented graphically, using the same queries as I use when searching the web.  About half the time, I end up learning something that I hadn't anticipated learning.  Serendipity is your friend, and Image search lets serendipity happen! 

3.  (A small point)  I found the image of the Procamelus not by doing "regular" web search, but by searching on Wikimedia.  Normally, I think of Wikimedia as being the repository for all of the images on Wikipedia, but sometimes you can find images that appear only in the Wikimedia collection that don't seem to appear anywhere else in Wikipedia.  This is incredibly handy for teachers (and blog post writers) because they come with the copyright information and are often uncommon images.  It's easy to search this space, just use a site: query like this:  [ site:wikimedia.org procamelus ] You'll find all of the images you might need, along with useful copyright information.  


Ending note: 
This week's post took longer than normal for a couple of reasons--the book needed attention, I had a few things to do at work, and there was a bug in Blogger than I needed to run down.  (One of the downsides of working at Google is that I feel obligated to help find bugs in our products. C'est la vie.)  
As I was feeling bad about being slow to stick to the publication cycle, I realized that the rest of the summer is going to be busy as well.  I'm teaching a few search classes in Europe, and taking a bit of vacation in places that won't have Wifi, nor will I have my computer.  These places should be fun, and should lead to even more interesting SearchResearch Challenges.  
I'll keep writing, and will write something every week (unless I know I'm going to be off the grid, but I'll give a heads-up when I know...).  

Until then, Search on!  


Wednesday, June 20, 2018

SearchResearch Challenge (6/20/18): How big was the range of these animals?


Going beyond avocados and onto animals! 

As you recall, one of important ways that avocado seeds were dispersed was through the gullet of large animals (like the gomphothere).  Many of those animals are long gone--extinct.  But they left an indelible effect on our landscape, leaving a trail of guacamole behind them.    

That made me start to wonder about those beasts and what the landscape must have looked like back in the day when gomphotheres wandered around through southern Mexico and Central America.  


If I recall my Pleistocene history correctly, there were a LOT of charismatic megafauna back then--including ones that we think of as being native to some other places.  I associate sloths with South America, but there used to be really big sloths in North America as well (although there are none today).  Likewise, I think of lions in Africa and camels in the Middle East + Africa.  

But it wasn't always this way.  This leads to our fun SearchResearch Challenge for the week.  

If there were, once upon a time, lions and camels and ground sloths  (Oh my!) in North America, what was their historic region?  During the past 100,000 years, where could you find camels, lions, and ground sloths?  

Just as importantly, how do you do this search?  What queries do you need to figure this out? 

Be sure to let us know in the comments.  Share your knowledge about how to answer questions like this!  

Search on! 


Friday, June 15, 2018

Answer: Seed dispersal mechanisms for giant seeds? (And search strategies)

Avocados...  

... that fruit beloved of millennials on their toasts, that mainstay of guacamole, that luscious green ambrosial centerpiece of tortilla chips...  our lives would be poorer without it. 

But as you know, it's a food of the New World, having originated somewhere between southern Mexico and Peru.  There is some evidence that avocados were domesticated at least 3 times, resulting in the currently recognized Mexican (aoacatl), Guatemalan (quilaoacatl), and West Indian (tlacacolaocatl) landraces.  (See the Wikipedia entry on avocado.)  


As noted, that seed is pretty big.  And that led me to this week's SRS Challenges.  How would you work out the answers to these questions?  

1.  How are avocados dispersed?  If they rely on just falling from the tree, that doesn't seem to work well... so is the "natural" dispersal by animal?  If so, WHAT animal would eat an avocado... and then be big enough to carry it somewhere and leave it behind in a new place?    
I think I kind of gave away a big clue here by writing "dispersal" in the Challenge.  That's a huge suggestion of a specialized search term to use in your query:

     [ avocado dispersal ]


 this leads directly to a Smithsonian Magazine article Why the Avocado should have gone the way of the Dodo, which points out that:


 "The plant hit its evolutionary prime during the beginning of the Cenozoic era when megafauna, including mammoths, horses, gomphotheres [a kind of giant, now extinct, elephant]  and giant ground sloths ... roamed across North America, from Oregon to the panhandle of Florida. The fruit attracted these very large animals... that would then eat it whole, travel far distances and defecate, leaving the seed to grow in a new place."

This article is based on the writings of Connie Barlow in magazines like Biodiversity (article about avocados) and Arnoldia  (article about anachronistic fruits).  Both are well respected journals). And she's author of the book The Ghosts of Evolution, which is all about this topic.

To triangulate (that is, to get multiple perspectives on the same topic and look for agreements / disagreements).  It's fairly easy to get multiple articles by different authors  (e.g. National Geographic,  Science...) all of which agree on this interpretation of events.  


2.  Are there other plants with giant seeds (like the avocado's) and how do THEY get dispersed?  
This category of "anachronistic fruits" (that is, fruits that evolved in a very different ecosystem that now holds) include seeds of the canistel tree, the honey locust, and the Osage orange.  (From the Barlow article and that Science journal article.)  These all have the property that the ecosystem is missing animals (that used to be around, hence "anachronistic") that can disperse the seeds.


The fruits (and seeds within) are either large (Osage Orange, Avocado) or have a tough exterior (Honey Locust, Canistel).  In all these cases, the hypothesis is that really large animals, such as gomphotheres or giant ground sloths, would eat these fruits, and then deposit them later after they'd passed through a large animal digestive system, which would prepare them for germination and growth.


It takes a Gomphothere to eat, and process, an entire avocado.  (P/C Wikipedia.org) 


That is, these are really archaic fruits that literally belong to another time.  And, in the case of the avocado, a strong case can be made that after the demise of the megafauna, it was humans that propagated the bizarre avocado trees, and their seeds.

And a simple search for:   [ large seeds ]  leads handily to several lists of large seeds (e.g., the coco de mer), and then combining that name with dispersal leads directly to a discussion of how that particular seed is dispersed.  For instance: 

     [ coco de mer dispersal ] 

where you can learn that these giant seeds might have been an anachronistic fruit 65M years ago, but that currently, they're dispersed only nearby the parent trees.  (Apparently they're unable to float, so they can't colonize distant shores the way a coconut palm can. See the paper by Edwards, et al., in New Phytologist.)  But other giant seeds DO require animal interventions.  Again, I leave it to you to explore... 


3.  In writing this post, I’ve been looking for an early illustration of an avocado.  It's kind of tricky.  What’s a strategy for finding the earliest illustration of something?  In our case, an avocado seed... but how about finding an early illustration of ANY thing?  

Here's what I did to find an early illustration of an avocado.


Note that I was a bit vague, so any reasonably old illustration would do (although I admit that I was hoping for the first publication of the avocado).   Here are my four strategies...

1.  Work from Wikipedia's history (or any history of the object in question). The Wikipedia articles often give a reasonable history with references.  In this case, it clearly talks about avocados being mentioned in the Florentine Codex, a 16th-century report about Mesoamerica by the Spanish Franciscan friar Bernardino de Sahagún.  Interesting!  So I then did a search:

     [ "Florentine Codex" avocado ]


Here's the first image I could find, from roughly 1590.  


2.  Use a term that connotes age.  Often, older images or illustrations will be labeled with specific terms--archive, etching, engraving, etc.  My first guess at using a context term for age was "antique," so I incorporated this into my query:   

     [ antique avocado print ]

This kind of query implies pic from a particular era. And in particular, this leads to a lot of older prints/illustrations of avocados.  


But none of these really push the date back to far, but it definitely gives us a bunch of early-ish prints.  


3. Books search--set to an earlier date. I just searched for [ avocado ] in Google Books, and restricted my search to the 19th century, knowing full well that avocado was a rare word back then, so any mention probably would have been in a botanical journal.  Sure enough, I was able to find a nice illustration from 1891:

This appeared in Frank Leslie's Popular Monthly from 1891.  (Monthlies from this era often contained extensive illustrations--perfect for this kind of thing.)  I expect that more searching around would find more illustrations like this, and I leave this exploration to you.  


4. Search for the earliest publication explicitly. Often, the simplest way is the best.  When searching for an early publication or illustration, you can predict that someone will write something like "... and here's the earliest publication about avocados..." When I did this query, it worked out quite well.  This query:

    [ earliest publication avocado ] 

leads to a paper on "The Early History of the Avocado" (interestingly enough, from the AvocadoSource.com web site).  This paper refers to an early book, the Suma de Geografia, published in Seville, Spain, in 1519. In that era, Enciso travelled with the great navigator and cartographer, Juan de la Cosa, during one of the first exploration of the New Worlds. He described the avocado that he saw in one of the small harbors at the foot of the Sierra Nevada de Santa Marta (trans. by Wilson Popenoe; this quote is from "The Early History of the Avocado paper)
"Yaharo is a good port, with good lands and here are groves of many different sorts of edible fruits, among others is one which looks like an orange, and when it is ready for eating it turns yellowish; that which it contains is like butter and is of marvelous flavor, so good and pleasing to the palate that it is a marvelous thing."

This is great, but I'm looking for an illustration.  I checked Google Books for a scanned volume (hoping there would be an illustration there, but no dice--it's not scanned).  But this is a good clue--perhaps I can find an article that refers to the Suma de Geografia, and that would have an illustration.   So my next query was for:

     [ "Suma de Geografia" avocado ]

I checked Google Books (and Hathi Trust), but couldn't find a completely scanned version.  Then I looked in Images, and that led me quickly to this fascinating paper, "The Avocado (Persea Americana, Lauraceae) Crop in Mesoamerica: 10,000 Years of History" published in the Harvard Papers on Botany.  Reading through this text, I found the sentence 


"[in this diagram] Every figure emerges from the earth, and behind each of them there is a tree with fruits that include the cacao, avocado, soursop (Annona muricata L.), and chicozapote (Manilkara zapota )..." 
 with a reference to  another paper, "Observations on the Cross Motif at Palenque" by Linda Schele, published in Primera mesa redonda de Palenque (a conference on the art, iconography, history of Palenque). 

And in THAT paper from 1974, the author includes a detailed illustration from the Temple of Inscriptions, where on the east side of a sarcophagus is this (just a small piece of a much larger picture): 


The oval things are avocados.  The Temple of Inscriptions was completed around 683 AD, so I'd argue that this is probably the first illustration of an avocado--literally carved in stone.  

That's probably the earliest depiction of an avocado that I could find.  


Search Lessons 


There are a few here: 

1.  Using the right terms (e.g., dispersal) helps a lot!  In this Challenge, I gave you a big clue.  A precise, relatively rare term can help a lot.  

2. "Reading around" in the literature can give you many other terms for searching.  In my case I learned about "anachronistic fruits," which then opened up an entire literature for perusal.  

3.  There are many ways to find old illustrations--(a) working from the literature, (b) adding in a context term that suggests age, (c) searching for illustrations in books, (d) searching explicitly for "early illustration."  There are other ways that we'll cover in the future, but this is a good start on a short list of methods to find older pictures and illustrations.  


I'll be back next week with another update, and a new Challenge!  

Search on!