Thursday, June 5, 2014

Comment on SRS Challenges (UC system and "Daughter of Rula Lenska")

ONE of the fascinating things about writing these Challenges is how hard it is to determine when a question is going to be difficult.  I'd figured this "UC system" Challenge to be about 0.8 (out of 1)--hard, but not crazy-hard.  

I think that's because I know one tool that nobody has thought of yet; once you know the tool, the task is pretty simple.  

You're all on the right track--using the site: operator is the right idea; the question is, how can you do many such site: operations all at once?  Searching for an aggregate domain (something like UniversityOfCalifornia.edu) would be great, but I'll tell you that no such superdomain exists.  (If it had, you would have found it by now.)  

You could do a query like:  

     [ coral seminar June 2014 site:ucsd.edu OR site:ucdavis.edu OR    ] 

but that's pretty unwieldy.  

Hint:  Maybe the right question to ask yourself is this--Can I find a tool that will help me search over a set of web resources all at once?  

What would such a tool be?  Can you find it?  What might it be called?  

Once you figure out what tool to use, the questions will be answered fairly quickly.  

Keep searching!!  


Dan diving in the Bahamas with sharks. The one in front of me is an 8 foot long black-tipped reef shark.
Makes you realize that in some parts of the world you are NOT at the apex of the food chain.


Rula Lenska's Daughter... 

Several people have asked for more detail about finding Rula Lenska's daughter.  

I think Rosemary got in right (in the comments) when she pointed out that... 
"we have the daughter of a famous actress who seems to be living quite a ordinary life, it wasn't difficult to find the photos mentioned here already. However she is overshadowed by her parents & probably quite deliberately, therefore she doesn't have a huge presence on the internet. When searching for an average person we can use social networks and perhaps photos that have been tagged. We can search for hits by location, interests, work, and family. My take-away for this part of the challenge wasn't finding photos of her but realizing there are limitations based on a person's preference to be seen or not." 
In truth, I have no idea if she wants to be relatively anonymous or not, but I was a bit too glib when I said "it's easy to find pictures of her online."  

I did a version of Jon (the Unknown)'s query:  

     [ "brian deacon" AROUND (9) "lara deacon" ] 

(Jon, FWIW, that's the approved version of your "NEAR" operator.  The number in parens is the "radius" of words to search around.)  

And I also found the Tarnowskich.com family newsletter, which has a lovely wedding-day photo.  Then, an image search for her married name: 

     [ "lara deacon parker" ]  

which got me to her Rummikub photo (seems to be post-wedding, but clearly the same guy as in the wedding image).  

As others pointed out, there are a lot of "Lara Parker" and "Lara Deacon" images--almost none of which are the correct Lara Deacon Parker.  (Lara Deacon is a well-known actress, while Lara Parker is a relatively frequent name.)  In all these cases, you have to find the right Lara Deacon Parker and visually confirm that it's the same person.  


Search... and verify! 

Wednesday, June 4, 2014

Wednesday Search Challenge (6/4/14): Finding something in the UC system

Lionfish,  Bonaire (Sept, 2013)
AS YOU KNOW already, I'm a SCUBA diver, partial to warm oceans full of brilliant fish and transcendent corals.  

I'm also a Californian and a graduate of the University of California (UC) system.  In fact, it was when I was an undergraduate student at UC Irvine (southern California) that I learned how to use SCUBA, back in the days of Mike Nelson on Sea Hunt, K-valves and double-hose regulators.  My first real dive was in SoCal waters, probably 60F with limited visibilty.  I came back to the gym still in my thick wet suit chilled to the bone.  Luckily, a wet suit also holds warm water from the shower really well, and I recovered enough to go diving again the next day.  And the next.  

A couple of decades later, I'm still at it.  

Some of you might remember last year's Search Challenge about the Parrotfish.  

This is kind of an update on that Challenge.  You might remember that was a difficult research question that needed a lot of care and attention to detail.  

Today's challenge isn't quite like that, but it WILL stretch your ability to search in a new way.  

As an alum of the UC system, I'm really interested in what marine research is going on within the ten campuses of the UC.  None are very far from the Pacific, and I believe they all have some kind of marine biology research program.  

Can you help me out with these Challenges? 

1.  Can you find a talk (or seminar) that will be given somewhere in the UC schools during this week (between June 1 - 7, 2014) on some aspect of corals?  
2.  Remember my affinity for Parrotfish?  Is anyone in the UC system doing research on Parrotfish?  (Can you list their name(s) and what the gist of their research is?  Made-up example:  Dr. Smith at UCSD is studying feeding behavior of Bonarian Parrotfish.)  
3.  Suppose I decide to give up this crazy computer science lifestyle at Google and become a marine biologist. Which of the ten UC campuses has the best marine biology research program that I should join?   (Be sure to say why you believe that, given what you found in search.) 

As always, be sure to tell us HOW you solved these particular Challenges.  We're not racing, so take your time.  

HINT:  There are 10 schools in the UC system.  You should NOT be repeating a query 10 times for each school.  (This is true in general: Anytime you find yourself manually doing something repeatedly, stop and ask "is there a better, more automated way to do this?" Usually the answer is yes.)   

I'll give some discussion about these challenges tomorrow, and another big hint (unless people have figured out the Google-fu needed to pull this one off).  

Search on! 

Dan diving on a wall in Bonaire (Sept, 2013)


Friday, May 30, 2014

Answer: Four (six!) small challenges

As I said, THAT was interesting. 

I'm trying to develop a method for determining what people know about searching. One of the big problems is that you can't just walk up and ask someone "Tell me everything you know about searching!"  That's guaranteed to fail.  

What's more, you can't even ask them specific questions.  If you say "When would you use a feature like filetype: ?"  a smart person can more-or-less figure it out from the question itself.  

In general, figuring out what people know about a topic is pretty hard.  So I came up with this idea of asking "how long would it take you to solve this question?"

I was hoping that if you didn't know how to solve the challenge, you'd estimate a very high number ("it would take me 20 minutes to do that").  Contrariwise, if the challenge was thought to be simpler, you'd estimate a lower amount of time ("that would take 1 minute").  

Or at least that's what I thought.  So I posed a question, had you estimate how long it would take, and then had you solve the challenge and report back about how long it actually took to solve it.  As usual, the reality is much more interesting.  

The first challenge had four questions:  


1A.  How long would it take you to find a picture (any picture will do) of the current Princess of Norway?  
2A.  How long would it take you to find data describing the unemployment rate of Santa Clara County (California) for the past 10 years?  (You're looking for a table or a chart containing the data.) 
3A.  How long would it take you to find a picture of Neil Armstrong standing on the moon that was published in The Guardian newspaper sometime in the past 30 years?  
4A. How long would it take you to figure out how many times the name "Lothario" appears in the book "Moby Dick"?

The first two were intentionally simple.  I did that so you'd get the idea of how the survey worked, and would have a couple of successes. 

Questions 3A and 4A were supposed to be harder.  

Unfortunately, they were also pretty simple.  

1A.  Finding a picture of the current Princess of Norway is easy. A search like: [ Norway Princess ] will do it.  Just go to Images, and there she is.  There are lots of pictures of Mette-Marit, Crown Princess of Norway and Princess Märtha Louise of Norway.  Mete-Marit married into the family, while Märtha Louise is the only daughter of King Harald V and Queen Sonja.  

2A.  How long would it take you to find data describing the unemployment rate of Santa Clara County (California) for the past 10 years?   I thought that this might be a little tricker than it was.  Turns out that the obvious query [ unemployment rate Santa Clara county ] triggers the Google Public Data Explorer onebox, which gives you everything you'd want. 


3A.  How long would it take you to find a picture of Neil Armstrong standing on the moon that was published in The Guardian newspaper sometime in the past 30 years? This was supposed to require some clever date restriction filtering.  (That's the way I solved it!)  But I didn't check the simple, obvious, and straightforward query [ Neil Armstrong moon Guardian ].  Sure enough, a nice image shows up on the first page.  (In retrospect, I should have asked for the image to be printed in the Guardian newspaper in the 1970s.  That would have made it a bit more tricky.) 


4A. How long would it take you to figure out how many times the name "Lothario" appears in the book "Moby Dick"?  

This question was interesting.  This was the first question were I asked for an answer.  


4C.  And how many times DOES the name "Lothario" appear in "Moby Dick"?

You were supposed to type in an answer based on what you found.  Interestingly, 27% of the respondents got the answer wrong.  The correct answer is 2 (while all of the wrong answers were only 1; they missed the second appearance because it was hidden below the fold).  

I found this by downloading the full-text of Moby Dick from Project Gutenberg and then opening this text file in Chrome and searching for "Lothario."  You'll find that name mentioned twice.  
"...he cannot keep the most notorious Lothario out of his bed; for, alas! all fish bed in common..." 
and a few paragraphs later 
"Gently he insinuates his vast bulk among them again and revels there awhile, still in tantalizing vicinity to young Lothario..."  

In looking at the estimates of time vs. the actual time required, it became clear that the guesses were... interesting.  Mostly people guessed that the tasks would take longer than they really did.  Guesses and Actuals ranged from:  

Ranges: 
     1.  Guess:  5 seconds to 5 minutes.       Actual:  2 seconds to 2 minutes
     2.  Guess:  8 seconds to 15 minutes.    Actual:  5 seconds to 16 minutes (1 outlier at 51)
     3.  Guess:  6 seconds to 25 minutes.    Actual:  5 seconds to 28 minutes
     4.  Guess:  12 seconds to 30 minutes.  Actual: 11 seconds to 10 minutes

Medians: 
     1.  Guess:  1 minute.    Actual:  10 seconds 
     2.  Guess:  5 minutes.  Actual:  1 minute 
     3.  Guess:  2 minutes.  Actual:  1.75 minutes
     4.  Guess:  3 minutes.  Actual:  1.5 minutes


This tells me that we're not especially good at estimating how long a search task will take.  Many people were off by a factor of 2! 


This is also what prompted me to add two additional questions--ones that I thought would be much harder than the previous four.  I was thinking that maybe, just maybe, these questions were way too easy.  

So I added questions 5 and 6.  (Which I unfortunately labeled as 1 and 2 on the second survey.  Here I'll just call them numbers 5 and 6.)  


5A.  How long would it take you to find a picture of Rosa Lubienski's daughter? 
6A. How long would it take you to figure out how many times the name "Absalom" appears in the King James Bible?

These were significantly more difficult.  

5A.  How long would it take you to find a picture of Rosa Lubienski's daughter?  
To solve this you first have to figure out who "Rosa Lubienski" is (turns out she's an actress whose stage name is "Rula Lenska," an English actress of Polish descent who became well-known in the 1970s).  Once you know that, you can find her daughter's name, Lara Parker Deacon, and Google Images has plenty of pictures of her.  

This is a multi-step problem; interesting, but not super-difficult. By contrast, the last question IS fairly tricky, even though it looks very similar to challenge #4 above.  


6A. How long would it take you to figure out how many times the name "Absalom" appears in the King James Bible?

Again, I did the same thing as before.  Looked for the King James Bible on Gutenberg, downloaded it, and used Control-F in Chrome to find that "Absalom" appears 109 times.  (Although because there are variant versions of the KJB, I also scored 108 as correct.) 

Several people used a Bible search site (www.KingJamesBibleOnline.org) to search for Absalom.  They're the people who answered that the word occurs 90 times.  (Note to those folks:  That site counts the number of verses in which the word occurs, not the number of times the word "Absalom" appears.   You have to read carefully!) 

This time around: 

Ranges: 
     5.  Guess:     5 seconds to 20 minutes.    Actual:  27 seconds to 11 minutes
     6.  Guess:  20 seconds to 10 minutes.    Actual:  20 seconds to 10 minutes

Medians: 
     5.  Guess:  180 seconds.    Actual:   96 seconds 
     6.  Guess:  180 seconds.    Actual:   85 seconds.  

This doesn't look inspiring, but here's the thing that's not in the guesses and timing tables....  

Everyone did questions 1 - 4; mostly correctly.  They estimated high, but were able to do the challenge quickly.  

But questions 5 and 6 were much trickier.  

Question 5 (Rula):  Of the 5 people who said it would take 10 minutes or more, 4/5 of them were not able to do the task at all.  In general, people who said that it would take 10 minutes or more found it really did take that long, or that it was impossible.  

Question 6 (Absalom):  Only 32% of the people who answered "Absalom" question actually got it right.  There was no correlation between the time they estimated, the time they actually took to solve the problem, OR their accuracy.  


My takeaways: 

1.  It's hard to estimate the difficulty of a search task.  Regular readers of SRS know that something might LOOK simple, but turn out to be hard; and vice-versa--it looks hard, but turns out to be simple. 

2.  On the other hand, searchers who practice can estimate time-to-answer better than people who don't practice.  In another study, I asked 500 people the "Absalom" question.  90% of them said it would take around 1 minute to do.  Really?  I suspect that people who don't search much have a distorted view of what's possible to find online.  (They're a bit over-optimistic!)  I had a smaller sample of non-SRS people do the "Absalom" problem.  They were also all over-optimistic.  

3.  But when something really IS hard, and LOOKS hard... it usually is.   Again, experience really helps when estimating.  This is an underappreciated metacognitive skill (that is, the MC skill of understanding how hard a task will be, and what you need to do to complete it).  

4.  People still don't check their work.  The "Absalom" question is a good example of this.  For the people who used the KingJamesBibleOnline web site, the answer is correct.... but the number of 90 hits is measured in VERSES, not number of instances of the term "Absalom"!  

5.  We find it VERY difficult to estimate the number of queries we do / day.  Out of the first 100 people to responded to the survey, the average number of reported queries / day was 30.  I suspect this is a high estimate.  When I've surveyed before, I find that people often mis-estimate by as much as a factor of 5.  To give you sense of this, I checked my number-of-queries for the past 4 days:  20 (May 26), 17 (May 27), 22 (May 28), 16 (May 29).  And so on.  I'll have to send out another survey to discovery what people estimate, and then what number they find by looking at Google.com/history -- you can see all of your searches listed there (assuming you have it turned on).  Check it out--tell us how close your estimate is wrt the actual number. 


Overall, did this help my quest?  Absolutely.  Stayed tuned, I'll report back... after a bit more development.  Thanks for helping out.  


Search on!  


Thursday, May 29, 2014

Thursday commentary on yesterday's Challenges

Fascinating.

I just glanced at the data coming back, and the interesting thing is that people are actually OVER estimating how long it would take to accomplish the task.  I assume that means you're being generally favorably surprised.  That's great!

But now I'm curious what would happen if I changed the questions slightly.

So, for those of you that find these kinds of mini-challenges interesting, here's a follow-up survey.

This one just has two questions, and as you can see, they're just variations on the questions from yesterday's challenge.

Can you do these two questions as well?  Here's the link to the survey form #2 if you want to fill it out there.  Or fill out the form below.  

Thanks!

Longer discussion tomorrow.


Wednesday, May 28, 2014

Wednesday Search Challenge (5/28/14): Four small challenges

This week I'd like to do something slightly different.  

As you know, my day job is to understand how people search.  Part of that is understanding what people know about what's possible to do on Google.  Can you find images?  Sure!  Can you find an image of baseball Hall of Famer Babe Ruth drinking a beer?  Um.. maybe.  What about a picture of Babe Ruth with current supermodel Kate Upton?  

A big part of search skill is knowing what's possible to do.  But a hard research problem for the field has been to try and get at that inside information.  You can't just ask someone, "Tell me everything you know about search."  

So that leads me to try this new method for estimating what people know/don't-know about their search skills.  

It's a simple 4-question survey that I'd like you to fill out.  It LOOKS long, but it's really the same 4 questions presented twice. 

The first time you see the question, it's asking you for an estimate of how long you think it will take you.  

The second time you see the question, it asks you to actually DO the Challenge and then report back on how long it took.  

First you estimate; then you actually do the task.  Both times you just enter the time (in minutes-and-seconds).  

I expect most SearchResearch Readers will be able to do this in about 5 minutes.  It's okay to take more time than that, in fact, the difference between what you estimate and what you actually take is really of interest to me.  You might estimate that something will take 3 minutes, but it actually takes 30 seconds.  Interesting.  And, vice-versa, you might guess that a task will take 30 seconds, but it actually takes 3 minutes.  Also interesting.  

Here's the survey.  Go ahead and fill it out when you've got a few minutes to work on it.  You don't need to do it all at once, you can do one pair of questions, then come back and do the next pair.  

Just be sure to hit SUBMIT before Thursday, May 29th at midnight, Hawaiian Standard Time.  (I'll need a couple of hours to look at the results and see what we've got.)  

When you're ready.... 

Click on this link to open it in a new window:  Here's the link to the survey   

Or you can just fill out the survey below.  


Thanks for your help!  Answers and feedback on Friday! 

Search on.  (And time yourself!) 


Friday, May 23, 2014

Answer: How much does a country spend on schools?


How much a country spends on its schools isn't the only factor that determines how well the students are taught or how much they learn... but it's a measure of the investment a country chooses to place in its youth.  

Setting aside all of the debates about school policies, how can we answer these two simple questions? 

The Challenge from Wednesday had two parts:  


1.  Can you find the data on which my graph is built?  And, once you find it, can you create a chart showing the investment-per-pupil for Serbia, Singapore, US, Finland (and maybe one or two other countries of your choice)?  
2.  If you've got the time and inclination, can you discover why Singapore manages to spend so little per student, and still have a great school system?  (This is clearly extra credit.)  

Answers:  

The first thing I realized when setting up this question is that it's a little ambiguous.  I wrote it that way to make a point:  Many times research questions ARE ambiguous.  Part of your task as a researcher is to clarify the question itself.  

When you start looking for data about the investment-per-pupil, are we talking about ALL students in a country?  Did I mean K-12?  How about junior colleges?  Universities?  Vocational schools?  

I started by first doing the search:  

     [ expenditure per student ] 

just to see what I'd find.  The results are pretty good:  International results from the World Bank (#2 below) are mixed in with US states results.  


The data is even normalized as a "% of GDP per capita," which isn't bad at all. 

If you go to that site, you can very quickly reproduce the chart I showed in the Challenge. 


Chart 1:
World Bank data "Expenditure per student, primary, % of GDP per capita" 

Here's the query that creates the above chart.  It's pretty straightforward--just use their mapping tool and select the countries you want.  

Now, if the truth were told, that's NOT what I was hoping you'd do!  

I wanted to have you discover that Google's Public Data Explorer ALSO has this data from the World Bank, and offers a very nice charting suite as well!  

If you visit the Google Public Data Explorer (PDE) site, and do the same query, you'll find many slightly different data sets of the equivalent data.  


And if you go to the second link in the results, you can create a very nice graph showing the same data.  
That chart will look like this: 


Chart 2:  
Google PDE chart of World Bank data on "Public spending on education, total % of GDP"


Now, compare this chart with the one we charted using the World Bank data (Chart 1, above).  

THEY'RE NOT THE SAME.  They're not even close.  What happened?  

It took me a minute to notice that there are actually more than one data set here.  In fact, when I clicked on the second data set in the PDE, I was pulling World Bank data about "public spending on education total, as a % of GDP."  That's great data, but it's not the same as "expenditure per student, primary"!   

Lesson:  Be very, very careful about the metadata that describes the data set you're analyzing.  It's telling you what you need to know; but you HAVE to read it carefully.  

So let's go back to the PDE data set and select the FIRST link in the PDE results page.  


Chart 3:  Expenditure per student - secondary. 

Note that Chart 3 is STILL not the same as Chart 1.  What gives now? 

Lesson:  I wasn't kidding: You still have to be careful.   Really pay attention to the metadata.   Look around the UI for options that let you change the view of the data.  Learn to read the UI to see what's possible!  


Look at the lower left.  There's an option selector that determines "Education levels" to show.  Here I've selected "secondary" (meaning, ages 12 - 18).  If you change that selector to "Primary"  (ages 5 - 11), you'll get a much different chart.  

(And yes, I know the definition of "primary" and "secondary" changes from country to country.  This is roughly what it means.)  


Chart 4:  Expenditure per student, PRIMARY grades only 


Now this chart looks like the chart we created at the World Bank site.  

Here's the thing to know:  The World Bank graph really IS the "expenditure per student, primary grades"... it says that.  But you have to read carefully.   

So I went back to the World Bank site to see if I could change the data set to Secondary, and see if that would match our Chart 3 from Google's PDE.  

Here's that chart.  Notice how much it looks like Chart 3 (the PDE version).  


Chart 5:  World Bank data for secondary schools expenditure 

I'd say we've figured it out.  

You can get the data straight from the World Bank itself, or get it from the PDE.  (As you can see by reading the Google PDE metadata, it's actually the same data. Google just scrapes it from the World Bank (with their agreement) and re-publishes it along with the visualization tool.)  


Now we can turn our attention to the second question:  How does Singapore get by spending so little?  (Relatively speaking.) 

One thing to notice when looking at the graphs is that Singapore is ALWAYS near the bottom of the spend-per-student charts.  Yet we know that they have superb schools.  

Interestingly, Serbia (with a total population of around 7M, and a student population of 1M) spends a LOT of money per student, but only in primary grades.  That seems to be because their population demographic is so young. There are lots of school-age kids in Serbia... 

To answer this fully probably requires writing a Master's thesis.  But to get a quick answer, I really liked Rosemary's approach.  She did a simple query: 

     [ Singapore low education GDP ] 

And discovered a bunch of articles on the topic.  Reading around just through these articles is fascinating.  

Interestingly, the #1 hit is blogger Roy Ngerng's post on "How is Singapore's Education System Unequal?"    He presents a lot of charts and data to make the case that Singapore is actually underperforming, suffers from inherent inequities,  and should be doing a better job.  

But in the middle of the data, it becomes clear that the Singaporean school system is doing a good job of teaching students (although with larger class sizes, and then NOT progressing all of their students to secondary school)!  It's a complex situation, but one of the side effects of this would be a reduced spend on students (because there are fewer of them).  It's also clear that this is a topic of some concern for Singaporeans, who are concerned that their schools aren't doing a better job. 

It helps quite a bit to be a small island nation, with all of the students in a fairly small, fairly homogenous region, although with a population that speaks many languages as their native tongue.  (By contrast, I don't know how much of US student expenditure is for transportation alone, but I suspect it's substantial.  The cost of moving books, meals, and students all around is going to be high.  The US also deals with a diversity of languages as well; although perhaps not with the intensity that Singapore has.)  

As I said, this is a large, complex topic, but Rosemary's approach is a good one:  Start with the simple and obvious query--read through the top ten articles or so; learn from that, then refine.  

Using a similar approach, Debbie G and Anne found an excellent overview article from the National Center for Educational Benchmarking which gives a one-page summary of how Singapore got to be where it is today (educationally speaking).   


Search lessons:  As we've learned, it's important to be very careful about the metadata of the data you're charting.  Be sure you've got the right sources AND understand what's in the data, and how it's defined.  (e.g. the definition of "primary" and "secondary" above).  

Remember that there are many places to get data of this form.  PDE just re-surfaces the World Bank data, but the UN also has data of this kind.  (But again, but careful of what you're comparing.)  

Finally, when dealing with a large complex topic ("How does Singapore not spend so much money on students?") be aware that you might not find a single answer, and that this is a question that you'll need to study for a while.  Searching for overview articles, and skimming the top-ten hits for a well-crafted query will get you a long way towards understanding the issues, even if you don't come out with a single, short answer that's suitable for putting onto a multiple-choice quiz.  


Search on! 


Wednesday, May 21, 2014

Wednesday Search Challenge (5/20/14): How much does a country spend on schools?


BECAUSE I teach a lot of students all around the globe, I've been thinking a good deal about how different countries think about their schools.  As I go from place to place, it's clear that countries differ greatly on their degree of investment.  

Naturally, I'd really like to see some data about this.  It's too easy to be impressed by one or two school visits, but not have any real sense for how an entire country actually manages their schools. 

That led me to create the following graph as an example of the kind of data I'm looking for.  


This is a chart of some data from a reputable source that shows a measure of how much four different countries (Serbia, the US, Singapore, Finland) spend on their schools.  The number is measure of how much is spent per pupil as a percentage of Gross Domestic Product per capita.  It shows (more-or-less) how much investment a country puts into its school system. 

There's an interesting paradoxical result here, though.  Singapore and Finland both have highly regarded school systems, but Finland (and the US) spend about 2X as much as Singapore on each student.  Then Serbia spends about 6X as much as Singapore!  

Today's challenge has two parts.... 

1.  Can you find the data on which my graph is built?  And, once you find it, can you create a chart showing the investment-per-pupil for Serbia, Singapore, US, Finland (and maybe one or two other countries of your choice)?  
2.  If you've got the time and inclination, can you discover why Singapore manages to spend so little per student, and still have a great school system?  (This is clearly extra credit.)  


Get schooled! 

Search on. 


Friday, May 16, 2014

Answer: How hard is that comet?

1.  What's the name of the robot probe that's headed to 67P/Churyumov-Gerasimenko, AND what's the name of the landing craft?  (As is traditional, they each have different names.)  
2.  The anchoring device was built by a member of the EU.  Can you figure out what company built the anchoring device?  (And what do they call the device?  As is traditional.. everything has a name... ) 
3.  Suppose we wanted to contact the members of the team who built this device.  Can you find a phone number or email address for them? 
4.  The anchoring device has a built-in g-force instrument to measure how hard the surface of the comet is.  What is the maximum g-force that this device can measure?  Hint:  Find the spec-sheet for the device.  (This one is really extra credit--a little harder than most)   

Answers:  

The name of the spacecraft isn't that hard to discover:  Starting with what we know,  a search for: 

     [67P/Churyumov-Gerasimenko] 

leads to the comet's Wikipedia page. From there it's a simple hop to find that the satellite is the Rosetta mission, being run by the ESA (European Space Agency).  I then did a SITE: search inside of ESA.int for more information about Rosetta and Philae (the lander).  

     [ site:esa.int  Rosetta ]  
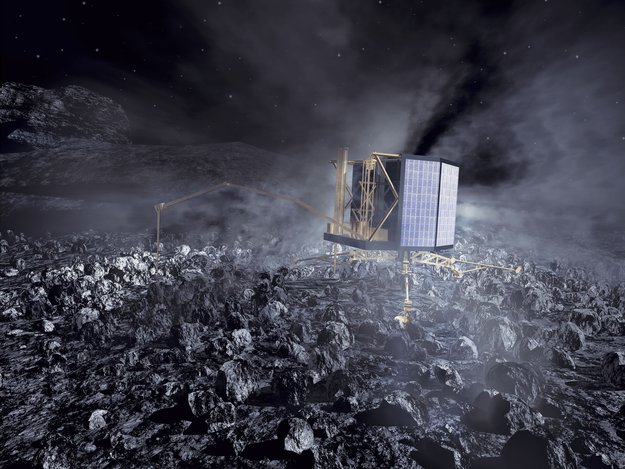
Image of Philae landing.  Courtesy ESA.int

and this spectacular image of Philae landing on the comet.  

2.  To figure out the anchoring system, I did a simple search: 

     [ Rosetta anchor ] 

which took me to the Rosetta press release page at ESA.int which in turn took me to the MUPUS web page. MUPUS is an acronym for 
Multi-Purpose Sensors for Surface and Subsurface Science.  It's the package of sensors on the Lander's anchor, probe, and exterior to measure the density, thermal and mechanical properties of the surface.

If you read that carefully, you'll see that it's not the anchor itself, but the sensor package ON the anchor.  

The Principal Investigator (PI) for MUPUS is Tilman Spohn at the Institut für Planetenforschung, Deutsches Zentrum für Luft- und Raumfahrt, Berlin, Germany.

We're close, but that's not quite the anchor itself.  So I backed up and did a search for just: 

     [ Philae ] 

and found the Wikipedia page for the Philae lander.  From that page we learn that "The Austrian Space Research Institute developed the lander's anchor and two sensors within MUPUS, which are integrated into the anchor tips. They indicate the temperature variations and the shock acceleration."

That's the nub of the question, and the shock measurement was done by the Austrians!  Once you know that, it's not hard to figure out that the Austrian Space Agency did the work at IWF Graz (Austria).  I then did a search for:  

     [ Austria space MUPUS harpoon ] 

Why did I include the word "harpoon"?  Because I'd seen it used in the ESA press release.
The MUPUS, with PEN and electromagnetic hammer
device incorporated. Note the windup reel at the
back of the device to provide tension once attached
to the body of the comet.  It really is a harpoon.
 I just figured that this was the specialty language they'd used.  (And if this hadn't worked, I would have tried "anchor" next.)  This is a funny terminology issue:  The harpoon device is also called the PEN. The PEN (short for "penetrator") is basically a hollow rod, 35 cm long, which will be deployed at a distance of about 1.5 m from the landing module and inserted into the cometary soil by means of an electromagnetic hammering mechanism.

I found the ESA document about MUPUS, which describes the work as being led by Tilman Spohn (at the Institut, which in English is the  Institute of Planetary Research at DLR Berlin). 

Most of the hardware for MUPUS was built and tested at the Space Research Center of the Polish Academy of Sciences, Warsaw, under the guidance of its present director Dr. Marek Banaszkiewicz.

You can see this is a real cross-European effort.  But who did the pressure probe that's built into the harpoon?  MUPUS is made up of many parts.  Who did the pressure sensor?  

The people most responsible for the pressure sensor system were listed on this MUPUS document:  Günter Kargl and Norbert I. Kömle at the Austrian Space Science Center in Graz.  (Now, with their names and work locations, it's trivial to get their email addresses and phone numbers. I'll leave that to you.)  

We're getting closer:  who built the harpoon itself?

This took a couple of queries, but the one that succeeded for me was 

     [ Philae Kömle harpoon ] 

(Where Kömle is one of the names of the Austrian team doing the pressure sensing package.) 

This search took me to the Philae Lander Fact Sheet, which clarifies everyone's role--who did what, and where. 

In this document you'll find that IWF did the design and performance testing, while MPE Garching built the hardware. (This is the Max Planck Institute, near Munich.)  In particular, IWF chose the accelerometer and temperature sensors for the probe.  Handily, they even specify the particular sensor model numbers!  "ANC-M is a shock accelerometer (ENDEVCO 2255B-1).  The attached conditioning electronics allows this sensor to measure a decceleration history with a frequency of 33kHz.  Decelerations up to 12,000 g can be measured with special conditioning of the sensor signal."  It goes on to say that "Engineering models for the comet surface properties covered a range for the compressive strength between 60 kPa and 2 MPa. The surface roughness is completely unknown. Extreme surface compressive strengths down to a few kPa are now covered as well."  

"kPa" and "MPa" are kilo-Pascals and mega-Pascals (units of pressure).    

I know that all parts (like sensors) have datasheets for them.  So a quick search for: 

     [ ENDEVCO 2255B-1 datasheet ] 

took me to the maker's datasheet for the device.  It turns out that it was actually manufactured just down the road from the Googleplex in Sunnyvale, CA!  

http://www.datasheetarchive.com/2255B-01-datasheet.html

If you read this datasheet carefully, it looks like the Austrians figured out a way to clean up ("condition") the signal to get slight better performance than the manufacturer says is possible.  Excellent!  


Search Lessons:  There are several here.  

1.  I used SITE: to restrict my searches to just within ESA.  That's obviously not required (lots of people figured it out without this operator), but it's frequently a good tool for just this purpose.  (Searching with a single site.) 

2.  Using an investigator's name (Kömle) is often a great way to zero in on a topic.  Scientists tend to write papers on their topic of interest, and if you get a rare name like this, it's usually a fast way to zero in on info.  

3.  Sometimes you have to play around with speciality terms.  In this example, "anchor" and "harpoon" were good descriptions of the device we were searching for.  Sometimes one would work, sometimes the other.  It's still research after all! 

Search on! 


You can find out more about the Rosetta landing and anchoring system at this paper:  "The Rosetta Lander ("Philae") Investigations."  

Wednesday, May 14, 2014

Wednesday Search Challenge (5/14/14): How hard is that comet?

NOT LONG AGO a robot probe woke up after a long period of drifting through space.  

It was launched from a jungle space station, and has been traveling on an interception course from Earth, scheduled to arrive in November, 2014. 

The probe is crossing interplanetary space to rendezvous with 67P/Churyumov-Gerasimenko, a comet that was discovered by Klim Ivanovych Churyumov, who was looking at a photograph taken by Svetlana Ivanova Gerasimenko while searching for a different comet (32P/Comas Solà)  on September 11, 1969.  This accidental discovery led to the space agency building the robot probe with the goal of landing on the surface of the comet itself.  

Once the probe nears the surface of 67P/Churyumov-Gerasimenko, a small lander will detach from the orbiter and fly down to the surface of the comet, make contact with the nucleus, and then attempt to attach itself to the body of the comet.  Since the comet isn't gigantic, there's not enough of a gravity well to attract the lander firmly to the surface, so the lander will have to anchor itself onto the comet.  

This is all marvelous stuff, but I'm not sure I understand exactly how this will all happen.  Hence, today's Search Challenge. 

1.  What's the name of the robot probe that's headed to 67P/Churyumov-Gerasimenko, AND what's the name of the landing craft?  (As is traditional, they each have different names.)  
2.  The anchoring device was built by a member of the EU.  Can you figure out what company built the anchoring device?  (And what do they call the device?  As is traditional.. everything has a name... ) 
3.  Suppose we wanted to contact the members of the team who built this device.  Can you find a phone number or email address for them? 
4.  The anchoring device has a built-in g-force instrument to measure how hard the surface of the comet is.  What is the maximum g-force that this device can measure?  Hint:  Find the spec-sheet for the device.  (This one is really extra credit--a little harder than most)   


As is traditional with our SearchResearch Challenges, please let us know HOW you found the answers.  (All will be revealed on Friday.)  

Search on!